Each year since 2016, we have produced a comprehensive estimate of the size of the UK social impact investment market through our market data research. The purpose of this is to share insight on the development and composition of the current market as we see it evolving and identify further growth opportunities and trends.
The UK social impact investment market is a subset of the broader UK impact investment market as highlighted in Segment B and C of Figure 1 below with UK social impact investment in Segment A. For the purposes of the market sizing, social impact investment is defined as:
‘Investment into social purpose organisations such as charities, social enterprises, start-ups, or real assets such as social and affordable housing. The investment enables them to deliver products or services that create measurable, lasting social impact that improves people’s lives. Social impact investors are seeking positive social impact as well as a financial return and both investees and investor demonstrate social impact intent.’
Four broad segments of social impact investment
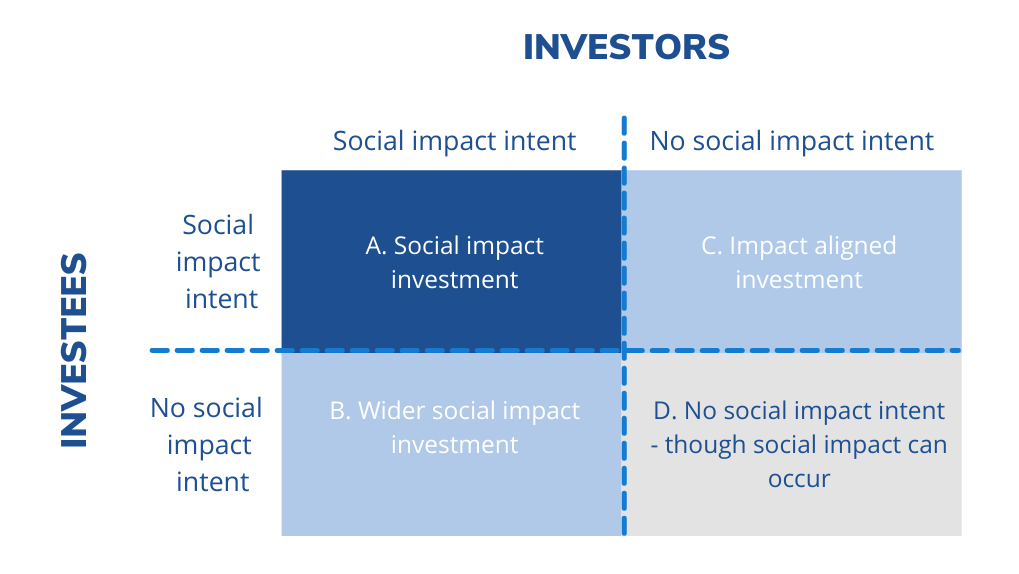
Figure 1
A – this is the segment our annual market sizing is focussed on. Social purpose organisations, such as social enterprises or charities that use repayable finance to help them increase their impact on society. For example, by growing their business, providing working capital for contract delivery, or buying assets.
B – where only the investor intends to make a positive social impact i.e., fund manager explicitly focussed on investing in social initiatives, invests in an organisation that doesn’t explicitly intend to have social impact, but it may be incidental.
C – where only the user (investee) intends to make a positive social impact i.e., an organisation delivering social impact that takes on repayable finance from a high street bank.
D - an initiative with primary environmental intent where social impact may occur i.e., through employment and/or education.
2021 market sizing methodology
To calculate an estimate of the market size, the team developed the following methodology to guide the research.
1. Build and refresh the market list of impact investing organisations that meet our definition and criteria
Our existing list of impact investing organisations incorporates our own portfolio of over 100 investments into fund managers and social banks combined with other UK based social investors who we are aware of through our wholesaler investor role and partnerships and meet our definition above (even though BSC has not itself invested). To test investor impact intent, we look for evidence such as articulation of impact goals, developed impact management processes and the production of an impact report. To test investee intent, we consider factors such as delivering a social service or targeting of specific social impact with its goods and services and asset locks for mission. Each year, we will also do a market scan to update any new investors added to the market that we are aware of and meet our definition and the following criteria:
- Organisations, specific funds, or investments that are both based in the UK and invest their capital in the UK (excludes overseas investments from UK based organisations)
- Organisations, specific funds, or investments focused on achieving social impact excluding investments focussed predominately on environmental impact i.e., includes community renewables but excludes green bonds
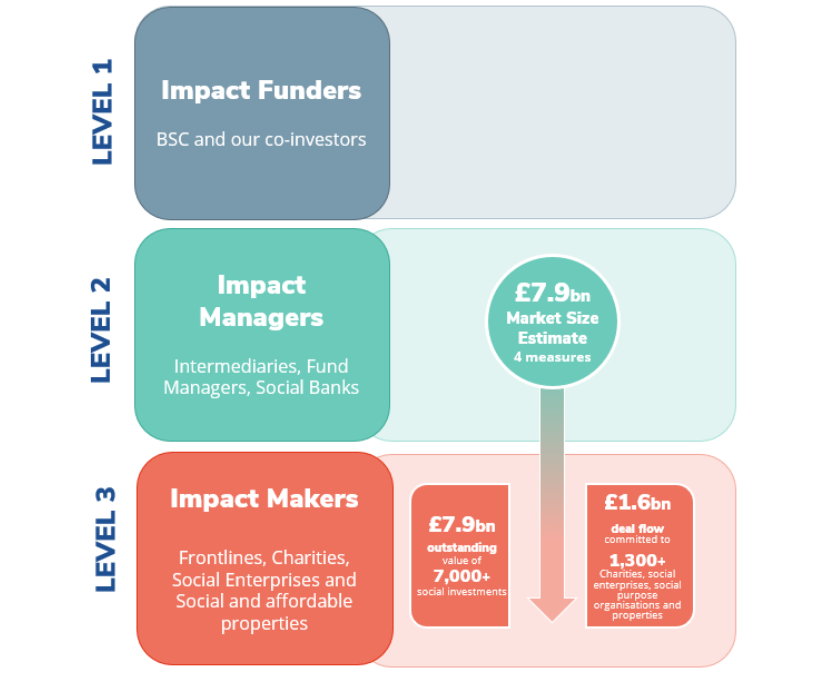
- Organisations, specific funds, or investments that make direct investments into charities, social enterprises, social purpose organisations or properties i.e., we collect market data at the investment manager level rather than investor level (i.e Level 2) as shown below.
Three levels of the social impact investment market
2. Define the key metrics and definitions for market sizing approach
We defined which metrics to use and agreed a set of definitions for these metrics to identify an estimate of the size of the market.
Metric A: Market size (£) is the current outstanding value of social impact investments (i.e., balance sheet amount) at 31/12/2021. It is the value of capital out (drawn down), less capital back in (repaid) plus/minus valuation adjustments. This also includes the # of investments made that make up the total value of the market size identified. This is taken from publicly available releases on fund managers’ websites, or from reporting received from fund managers when data is not publicly available. We anonymise the individual amounts attributable to each investor as not all the data is publicly available.
Metric B: Deal Flow (£) is the amount of social impact investment commitments made in 2021. This also includes the # of investments that make up the total amount of deal flow. This can be harder to achieve consistency in as not all fund managers measure a commitment at the same time. It may be “Investment Committee approval” or “legally signed date”.
- Collect and aggregate key metric data for list of impact investing organisation
For each of these organisations, we collect data on Metric A and B through the methods below:
- Our own portfolio data through valuation information available to Big Society Capital
- Publicly available sources i.e., published annual reports and balance sheets
- Direct requests and contributions from partner and non-partner organisations to provide figures for their investments, on the basis that this would be aggregated into product level categories and not individually attributable back to intermediary level.
For any new investors added to the 2021 estimate, we also went back to prior years and added metrics for those to ensure comparative periods were comparable.
Data considerations:
- For some contributors where data is only available on a financial year basis, we have calculated proxies to enable us to estimate on a calendar year basis.
- Where contributors are unable to provide us with outstanding value of investments and only provide deal flow, we have calculated proxies based on year-on-year deal flow.
- Given the nature of the market systems and different types of products included our approach in aggregating these metrics can vary for example:
a) For social and affordable housing, number of transactions may relate to no. of properties, no. of assets or no. of charity partners. This year, we have retrospectively updated some of the funds outstanding number of deals to show number of properties, which results in an increase in number from our 2020 estimate. When comparing across the market, it is important to note this increase and how it differs from our 2020 release. The 2020 figures have been updated to reflect representative year on year growth.
b) For impact venture, given the nature of some of the funds included, we ensure only commitments that meet our definition of social impact investment are included in our overall figures. The outstanding value will represent those commitments only rather than the full fund.
4. Benchmark our findings and compare to our prior years and other organisations’ market sizing reports
To sense check our findings, we compare the aggregated key metrics against our previous years’ market sizing to understand the growth of the market and growth or reduction in individual products or asset classes. We review our methodology and compare our market size value and deal flow amount against other social investment organisations who have completed a similar exercise i.e., GIIN, European NABS and the Impact Investing institute.

